Identifying workload consumption footprint
What are MIPS, or MSUs? MIPS are "million instructions per second", its an arbitrary metric used on z/OS mainframes. Each machine type and mainframe processor has a different maximum MIPS value.
So it will depend on which machine you have, and how many processors you have activated. MSU's are something similar, they are called "million service units" - or in the industry also called "mystery service units", because nobody really knows how they are calculated. However it is common knowledge that the ratio between MIPS and MSU are about 1:8 (depending on machine type).
This article will focus on reducing the MIPS/MSU footprint, and therefore the cost for the workload.
There are several options to reduce the MIPS workload. However, it is important to reduce the workload in conjunction with the pricing model and the mainframe capacity.
We first have to understand where our consumption footprint is and then reduce it where it makes sense, for that we also need to understand pricing.
Obtaining consumption metrics (SMF)
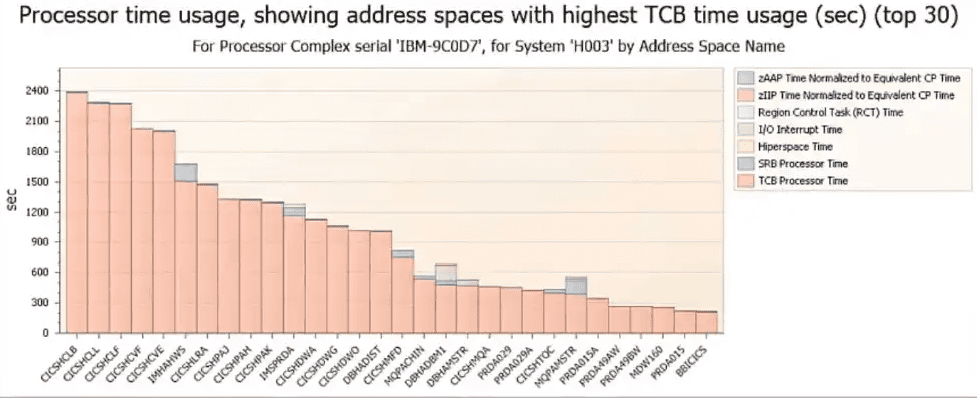
Using detailed printed SMF records (CICS 115, 116, AS 30, DB2 100, 101, 102) for each “address space”, SQL statement, DLI call and CICS/IMS transaction a footprint can be established. Additionally RMF reports can be used, usually most of the workload activity is recorded using SMF or RMF on a mainframe LPAR.
SMF - System Management Facilities is equipped with several utilities, which allow dumping the SMF records - however you might still require a formatting tool (such as SAS, MICS or MXG). The format of the SMF records and how to print them is also documented: LINK
Allbeit, not easy to make them readable. Alternatively your capacity reporting through RMF, might already provide you with the necessary footprint.
We want to know:
- Which batch programs and utilities have the highest consumption
- Which transaction and SQL/DLI statements cause the highest consumption
- When does the consumption happen
- How often does the consumption happen
Illustration of MIPS consumption during the day:
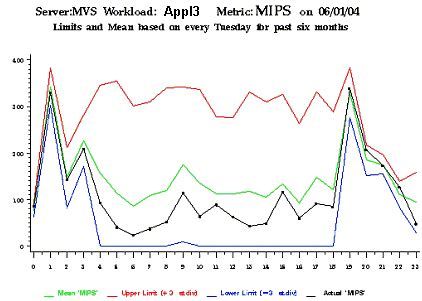
Understanding which address spaces, task control blocks, transactions and SQL/DLI statements cause your “workload peak” is imperative to develop a MIPS/MSU reduction strategy
High MIPS usage can be caused by:
- sub-optimal programming
- sub-optimal data and database usage
- not shuffling workload into off-peak hours
- not leveraging cheaper workload processors or runtimes
If you need help in creating mainframe workload migration strategies, or their execution, do not hesitate to reach out to info@techforge.llc
Feel free to download the "How to save MIPS" whitepaper on the right or below, no subscription or registration required!