Mainframe Pricing Model
MIPS/MSU saving is a direct result of the need to save cost. In order to save cost we have to reduce MIPS or MSU. Depending on how the MSU or MIPS are priced, a different strategy needs to be in place.
The most common pricing model for z/OS workloads is the R4HA model. Which calculates the 4 hour rolling average of certain SMF records (systems management facility)
A new pricing model "Tailored Fit Pricing" containing two new pricing solutions, Enterprise Consumption and Enterprise Capacity, offer alternatives to the rolling four-hour average (R4HA) based pricing model, for both new and existing workloads, so those exist as well.
You can find a detailed description on the IBM documents below, which explain the pricing models and the 4 hour rolling average model.
Link to R4HA model
Link to tailored fit pricing model
Excerpt from the IBM pricing model:
"For purposes of MLC charges, IBM has historically used the peak rolling four-hour average of MSU usage, as reported by the Sub-Capacity Reporting Tool (SCRT). For a given product, the peak rolling fourhour average is based on the combined simultaneous peak utilization of the LPARs on which a product executes."
The first thing to understand is that most of IBM’s system software is categorized as monthly license charge (MLC) software. This means you pay for it monthly. Examples of MLC software include z/OS, Db2, IMS, CICS, MQSeries, COBOL, and others.
Basically, what happens with these pricing metrics is that your MSU usage is tracked and reported by LPAR (logical partition). You are charged based on the maximum rolling four-hour average (R4HA) MSU usage. MSU usage is continuously measured, and the R4HA is calculated. Every five minutes, a new measure of instantaneous MSU usage is taken, with the oldest measurement being discarded. Then a new average is calculated.
R4HA Pricing
The R4HA is tracked continuously, for each LPAR, over the course of the month. Then the metrics are evaluated based on the products installed in the LPARs. You are charged by product based on the peak utilization of the LPARs where that product runs.
Consumption & Capacity based pricing
The Capacity Model is relatively simple, you can use the capacity of the machine you bought. And you always pay for the maximum capacity.
The Consumption Model has a baseline that is set by looking at the previous 12 months’ MSU usage and then dividing by 12 to establish your monthly software cost. It simplifies the pricing because you’re only paying for what you use. If you underutilize your expected consumption amount, those additional MSUs are rolled over and can be used in the future. IBM also offers an incentive for growth above that committed baseline – so you will pay less for that growth than you would otherwise. Once a baseline is set, the growth is offered at reduced rates and there’s no additional qualification for those new workloads.
Reporting
All this information is collected and reported to IBM using the SCRT (Sub Capacity Reporting Tool). It uses the SMF 70-1 and SMF 89-1 / 89-2 records. So, you pay for what you use… sort of.
As we discussed in the first article of the series, it takes some tinkering to visualize the footprint, but effectivly SMF records are used to calculate the utilization of each product.
Conclusion
So, If we reduce the heavy peak periods and bring the average down, it will most likely result in cost savings.
That's why an analysis of the current workload, and when it is running is imperative.
If we can retrofit our workload to permanently reduce maximum capacity, that's even better.
Feel free to download the "How to save MIPS" whitepaper on the right or below, no subscription or registration required!
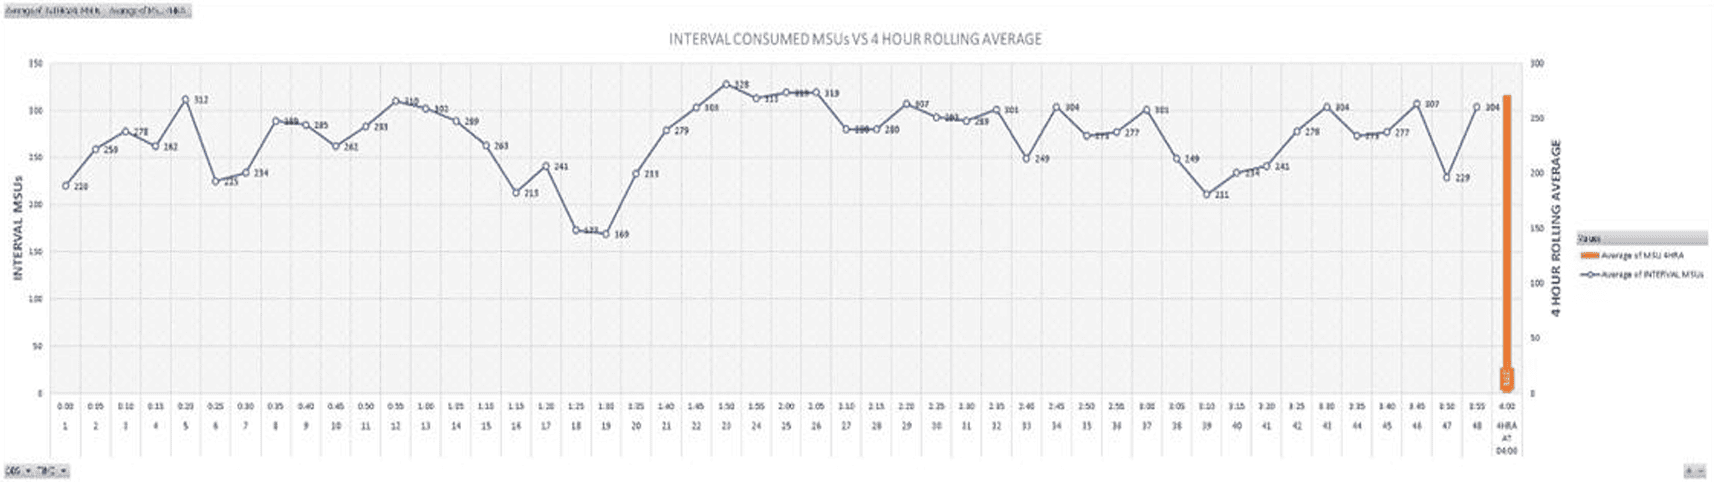
Below you can also see an illustration, of what a sample workload can look like over a 24 hour period. The time where during a period of 4 hours the highest peak is calculated, is used to calculate the usually monthly charge.